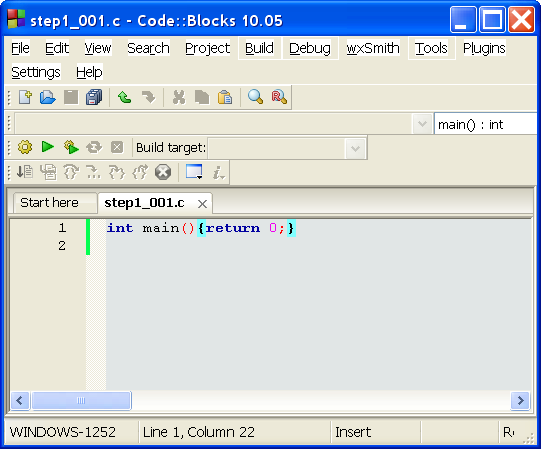
| main(){} |
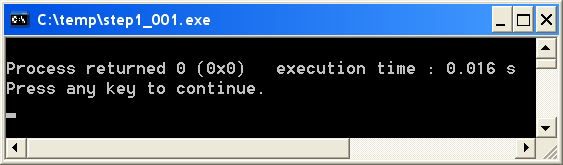
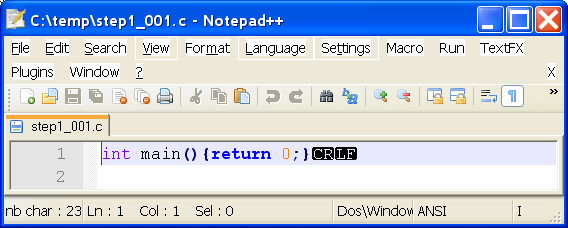
| int main(){return 0;} |
| ...\CodeBlocks\MinGW\bin\objdump -DsM intel
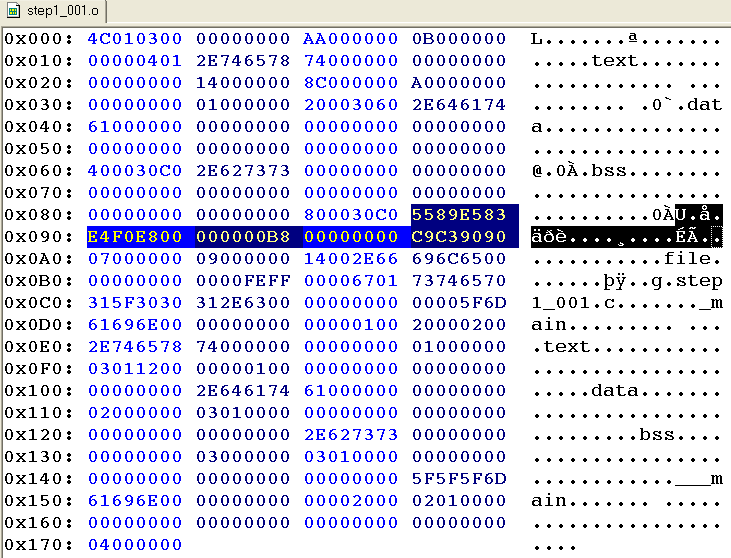
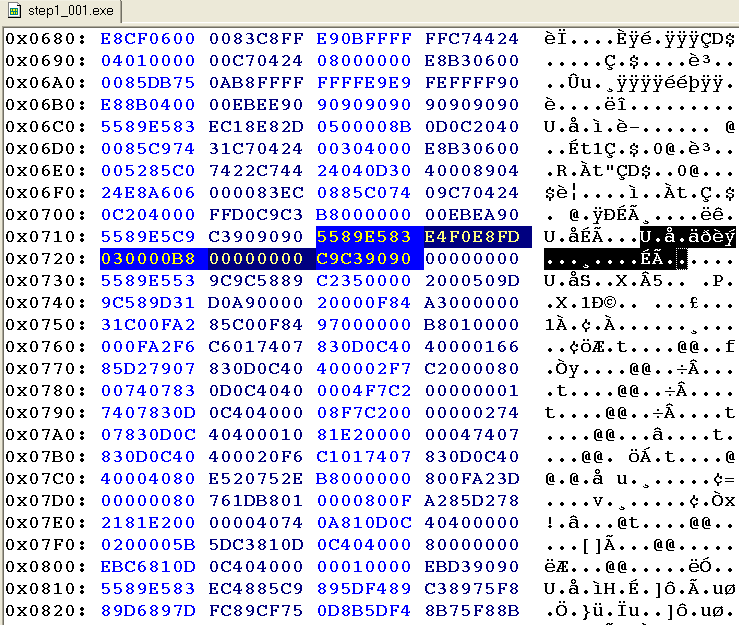
c:\temp\step1_001.o c:\temp\step1_001.o: file format pe-i386 Contents of section .text: 0000 5589e583 e4f0e800 000000b8 00000000 U............... 0010 c9c39090 .... Disassembly of section .text: 00000000 <_main>: 0: 55 push ebp 1: 89 e5 mov ebp,esp 3: 83 e4 f0 and esp,0xfffffff0 6: e8 00 00 00 00 call b <_main+0xb> b: b8 00 00 00 00 mov eax,0x0 10: c9 leave 11: c3 ret 12: 90 nop 13: 90 nop |
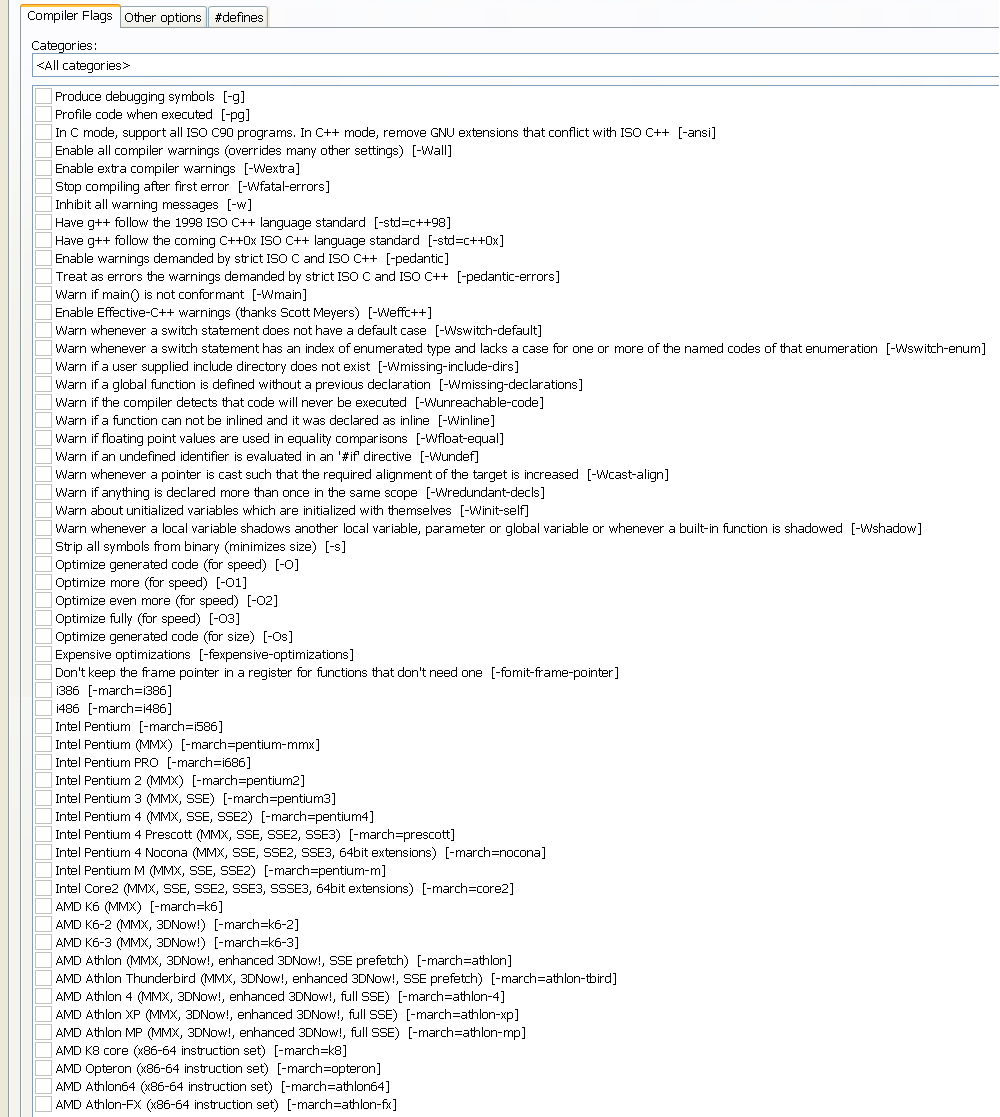
| -D
-s -M intel |
Display
assembler
contents
of
all
sections Display the full contents of all sections requested Display the assembler code in Intel syntax (instead of AT&T syntax) |
| No speed optimization, speed optimization
-O, -O1 : 00000000 <_main>: 0: 55 push ebp 1: 89 e5 mov ebp,esp 3: 83 e4 f0 and esp,0xfffffff0 6: e8 00 00 00 00 call b <_main+0xb> b: b8 00 00 00 00 mov eax,0x0 10: c9 leave 11: c3 ret |
| Speed optimization -O2, -O3, size
optimization -Os: 00000000 <_main>: 0: 55 push ebp 1: 89 e5 mov ebp,esp 3: 83 e4 f0 and esp,0xfffffff0 6: e8 00 00 00 00 call b <_main+0xb> b: 31 c0 xor eax,eax d: c9 leave e: c3 ret |
| ; prologue of the callee push ebp ; save ebp of the caller mov ebp, esp ; establish ebp of the callee ... ; body of the callee ; epilogue of the callee mov esp, ebp ; pop ebp ; re-establish ebp of the caller ret ; return to the saved eip of the caller |
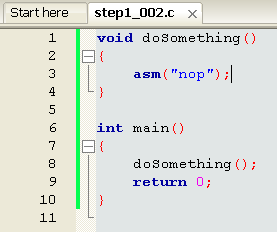
| ...\CodeBlocks\MinGW\bin\objdump
-DsM
intel
c:\temp\step1_002.o c:\temp\step1_002.o: file format pe-i386 Contents of section .text: 0000 5589e590 c9c35589 e583e4f0 e8000000 U.....U......... 0010 00e8eaff ffffb800 000000c9 c3909090 ................ Disassembly of section .text: 00000000 <_doSomething>: 0: 55 push ebp 1: 89 e5 mov ebp,esp 3: 90 nop 4: c9 leave 5: c3 ret 00000006 <_main>: 6: 55 push ebp 7: 89 e5 mov ebp,esp 9: 83 e4 f0 and esp,0xfffffff0 c: e8 00 00 00 00 call 11 <_main+0xb> 11: e8 ea ff ff ff call 0 <_doSomething> 16: b8 00 00 00 00 mov eax,0x0 1b: c9 leave 1c: c3 ret |
| local
variable 3 [ebp - 12] local variable 2 [ebp - 8] local variable 1 [ebp - 4] ebp of the caller [ebp + 0] return address [ebp + 4] argument 1 [ebp + 8] argument 2 [ebp + 12] |
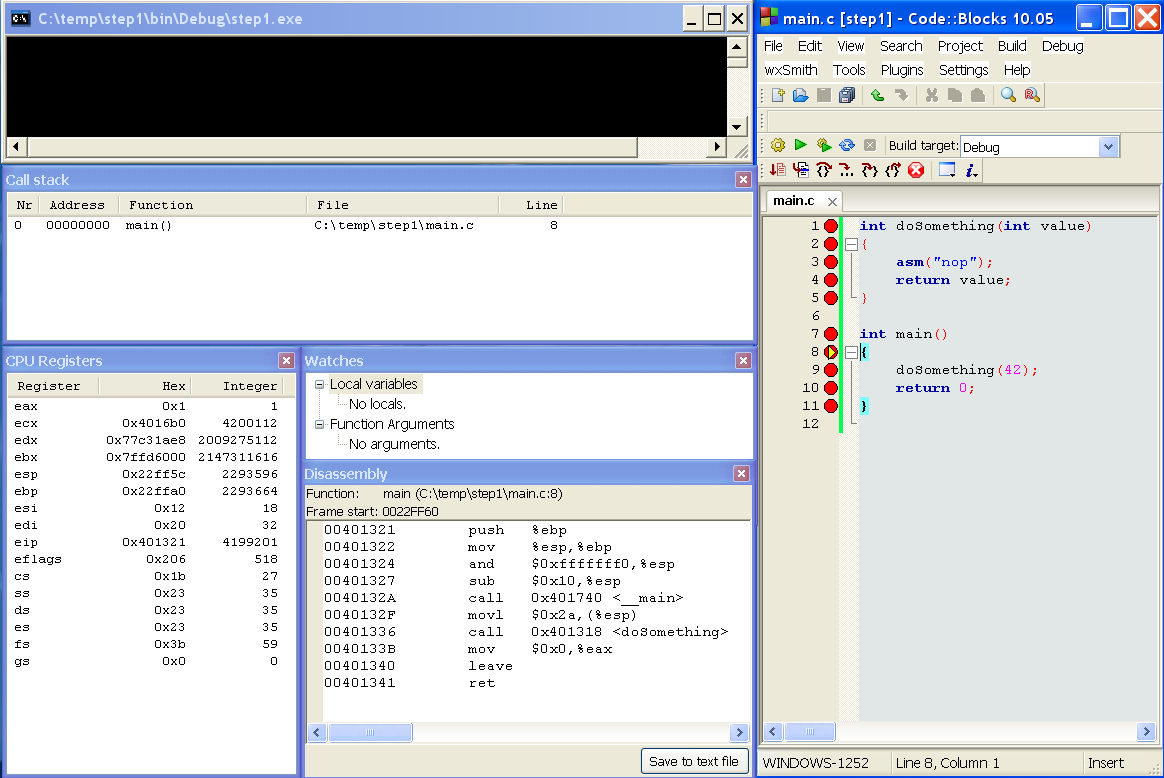
| int doSomething(int value) { asm("nop"); return value; } int main() { doSomething(42); return 0; } |
| 00000000 <_doSomething>: 0: 55 push ebp 1: 89 e5 mov ebp,esp 3: 90 nop 4: 8b 45 08 mov eax,DWORD PTR [ebp+0x8] 7: c9 leave 8: c3 ret 00000009 <_main>: 9: 55 push ebp a: 89 e5 mov ebp,esp c: 83 e4 f0 and esp,0xfffffff0 f: 83 ec 10 sub esp,0x10 12: e8 00 00 00 00 call 17 <_main+0xe> 17: c7 04 24 2a 00 00 00 mov DWORD PTR [esp],0x2a 1e: e8 dd ff ff ff call 0 <_doSomething> 23: b8 00 00 00 00 mov eax,0x0 28: c9 leave 29: c3 ret |
| Callee uses EAX, ECX, EDX: Scratch registers can be used for temporary storage without restrictions, also called caller-save or volatile registers. |
| Caller uses EBX, ESI, EDI: Callee-save or non-volatile registers have to be saved before using them and restored after using them. |
| You can rely on these registers having the same value after a call as before the call: EBX, ESI, EDI, EBP |
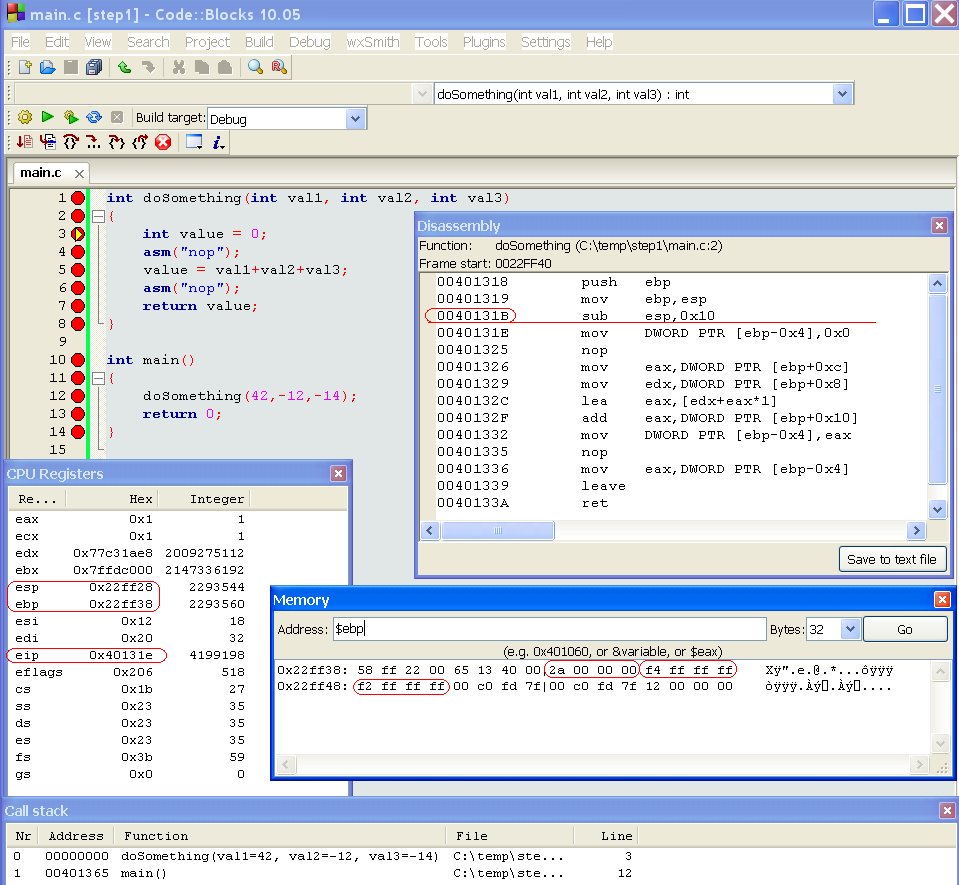
| int doSomething(int val1, int val2, int val3) { int value = 0; asm("nop"); value = val1+val2+val3; asm("nop"); return value; } int main() { doSomething(42,-12,-14); return 0; } |
| 0040133B
push
ebp 0040133C mov ebp,esp 0040133E and esp,0xfffffff0 00401341 sub esp,0x10 00401344 call 0x401760 <__main> 00401349 mov DWORD PTR [esp+0x8],0xfffffff2 00401351 mov DWORD PTR [esp+0x4],0xfffffff4 00401359 mov DWORD PTR [esp],0x2a 00401360 call 0x401318 <doSomething> 00401365 mov eax,0x0 0040136A leave 0040136B ret |
| 1st argument |
0x0000002a |
| 2nd argument |
0xfffffff4 |
| 3rd argument |
0xfffffff2 |